Stillwater Rosebud Water Quality Initiative
February, 2024
SRWQI News and Findings
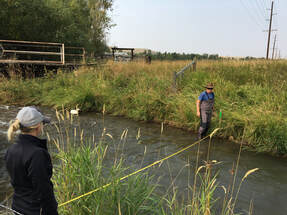
The Stillwater Rosebud Water Quality Initiative (SRWQI) began in September 2020 and has completed 40 months of stream monitoring in the Stillwater River and Rosebud Creek watersheds. We’ve been sampling for Total Suspended Solids (TSS), Total Nitrogen (TN), Nitrite+Nitrate Nitrogen (NO2+NO3-N) and Total Phosphorous (TP). Field parameters are measured with a Hanna field water quality meter. We’ve also measured the flow rate of Butcher Creek at Highway 78 near Absarokee, and of it’s two tributaries east of Roscoe.
Two monitoring locations were modified in October 2022, dropping two sites on upper Butcher Creek tributaries east of Roscoe, and adding two on the Stillwater River, one at the Moraine fishing access site below Nye and the other at Fireman’s Point near Columbus. With three sites on the Stillwater River, we’ve been accumulating basic water quality data on the entire mainstem. The backstory of this change, however, actually has to do with Butcher Creek.
The Butcher Creek Backstory
The SRWQI initially gave some emphasis to Butcher Creek due to the abundance of historical data collected on it, in the 1960’s by the US Geological Survey, and in the 1990’s by Stillwater Conservation District, NRCS and DEQ. These agencies in the 1990’s, in cooperation with landowners, made large investments in monitoring water quality and on-farm cost sharing projects to reduce the sediment and nutrient loads to Butcher Creek, the lower Rosebud and Stillwater rivers.
After taking a deep dive into all the stream flow and water quality data on Butcher Creek it appears that Butcher Creek in recent years is having a significantly smaller water quality impact than it did historically. We crunched some numbers and created some charts to inform you, so please take your seats and read on.
Rockin & Rollin in the 60’s
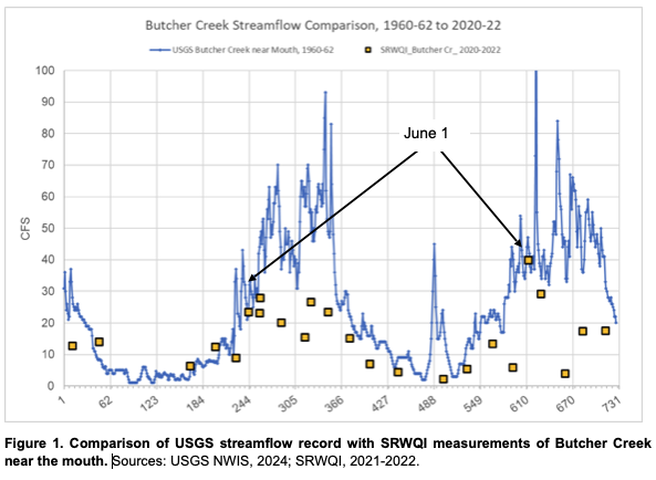
If you can remember that there was a USGS streamflow gaging station on Butcher Creek from September 1960 through September 1962, you are likely a resident super senior. In fact, there was, located just upstream of the current Highway 78 bridge near the Rockin J. This station logged the flow every day for two years before being abandoned. In Figure 1 below, we plotted the daily flow recorded by this gage with our own monthly flow measurements near the same location just downstream of the bridge. We normalized the two-year time scale to start with October 1 as day #1 to allow overplotting the 1960’s with the 2020’s.
Notice that starting June 1 of both years (day #243 and #608 respectively) our flows measured since 2020 are mostly much lower than those measured by USGS. It’s also relevant to note that our region was in a drought in 1960 and most of 1961, returning to normal and wetter conditions by 1962 (NOAA, 2024). This means that the higher flows of Butcher Creek measured throughout 1960-62 were not predominately caused by wet weather, but by irrigation water carriage and return flows.
Getting into Garth Brooks and Monitoring in the 90’s
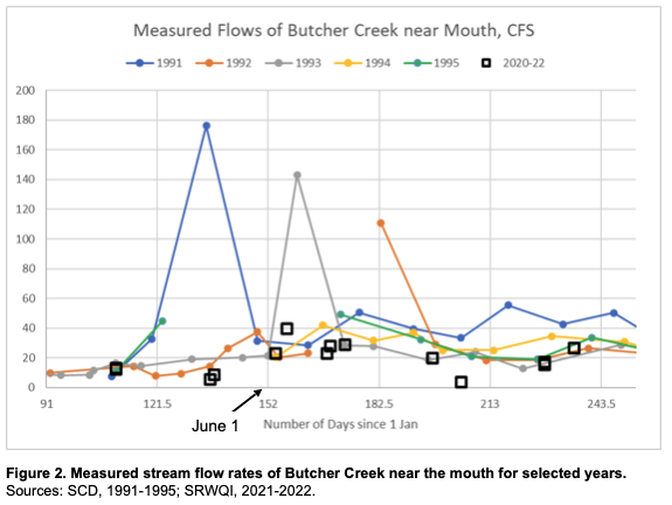
If you were sipping on a Crystal Pepsi and listening to Garth Brooks on your pickup radio as you turned up the Butcher Creek road in the 1990’s, you might have spied someone wading the creek taking some kind of measurement. A team of scientists from the SCS (now NRCS), the DHES (now DEQ) and the SCD (same old Stillwater Conservation District), with the help of our local landowners, spent eight years collecting flow and water quality information on Butcher Creek. The goal was to understand the extent and causes of non-point source degradation of Butcher Creek from runoff and irrigation return flows sufficiently to develop on the ground solutions.
We dug out those old files from the depths of the SCD office and extracted 67 flow measurements made from 1991 through 1995, mostly in the growing seasons. We again normalized the time scale to day-numbers, in this case with January 1 as #1. Figure 2 shows the 1990s flow measurements by year between April and October in colored lines. Our SRWQI project made 26 flow measurements between September 2020 and October 2022 which are plotted as individual points (black squares). The 2020 – 2022 flow measurements are mostly on the lower end or less than those made in the 1990s.
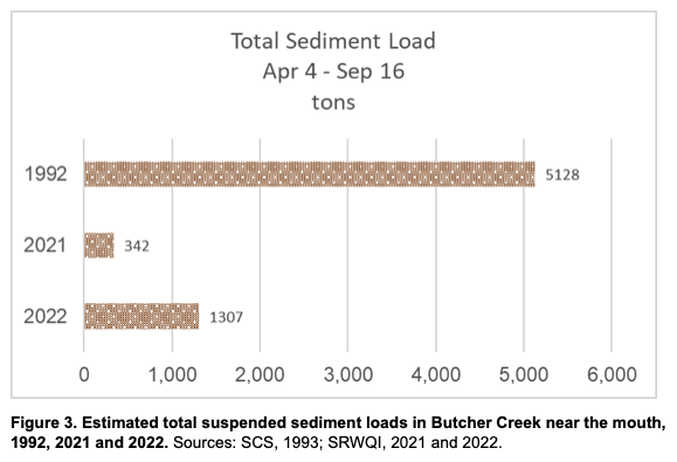
Thanks to the thorough science developed in the 1990s studies, we can also compare the suspended sediment load carried by Butcher Creek. The state SCS office at that time (D.Jones, 1993) used 15 paired flow and suspended sediment concentrations collected on Butcher Creek near the mouth to calculate an estimate of the total sediment load for the 1992 April-September period. We duplicated the same procedure using 14 paired flow and suspended sediment values from 2021 and 2022. Figure 3 is a bar chart showing the calculated total sediment loads in tons transported by Butcher Creek for April – September 1992, 2021 and 2022.
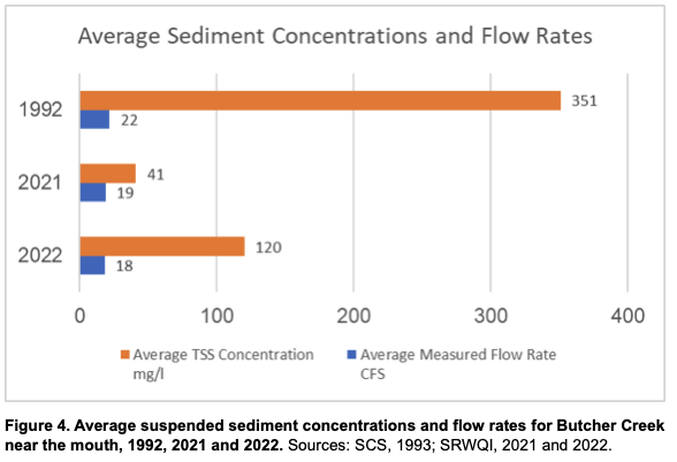
The same data allows us to compare the average suspended sediment concentrations and average stream flow rates for Butcher Creek near the mouth in Figure 4. Average sediment concentrations are shown in orange and average stream flow rates in blue for each of the years.
Good scientific assessments often lead us to new questions, and so we can ask why the sediment load of recent years appears to be much less than that documented in the 1990’s studies. Keep in mind that stream flow and sediment transport can vary greatly from year to year, and these data, while reliable, are snapshots in time. Subject to all appropriate limitations, we hypothesize that because recent growing season flow rates of Butcher are significantly less than historical, there is less erosion and sediment transport in the watershed. Lower flow rates, especially lower peak flows, may have allowed for the Butcher Creek channel and banks to better stabilize and revegetate. Some landowners have suggested that farm consolidation and changes in irrigation practices are likely reasons for these observations. We plan to continue our evaluation as more data become available, and we welcome the public’s thoughts and observations.
Stillwater Valley Watershed Council Coordinator, Lindsey Clark, stressed that the data collected by this project is of an educational and non-regulatory nature, intended to provide basic indicators of stream health to inform the residents of the Stillwater Valley and protect all the uses we make of our streams for this generation and those to come.
SRWQI News and Findings
The Stillwater Rosebud Water Quality Initiative (SRWQI) began in September 2020 and has completed 40 months of stream monitoring in the Stillwater River and Rosebud Creek watersheds. We’ve been sampling for Total Suspended Solids (TSS), Total Nitrogen (TN), Nitrite+Nitrate Nitrogen (NO2+NO3-N) and Total Phosphorous (TP). Field parameters are measured with a Hanna field water quality meter. We’ve also measured the flow rate of Butcher Creek at Highway 78 near Absarokee, and of it’s two tributaries east of Roscoe.
Two monitoring locations were modified in October 2022, dropping two sites on upper Butcher Creek tributaries east of Roscoe, and adding two on the Stillwater River, one at the Moraine fishing access site below Nye and the other at Fireman’s Point near Columbus. With three sites on the Stillwater River, we’ve been accumulating basic water quality data on the entire mainstem. The backstory of this change, however, actually has to do with Butcher Creek.
The Butcher Creek Backstory
The SRWQI initially gave some emphasis to Butcher Creek due to the abundance of historical data collected on it, in the 1960’s by the US Geological Survey, and in the 1990’s by Stillwater Conservation District, NRCS and DEQ. These agencies in the 1990’s, in cooperation with landowners, made large investments in monitoring water quality and on-farm cost sharing projects to reduce the sediment and nutrient loads to Butcher Creek, the lower Rosebud and Stillwater rivers.
After taking a deep dive into all the stream flow and water quality data on Butcher Creek it appears that Butcher Creek in recent years is having a significantly smaller water quality impact than it did historically. We crunched some numbers and created some charts to inform you, so please take your seats and read on.
Rockin & Rollin in the 60’s
If you can remember that there was a USGS streamflow gaging station on Butcher Creek from September 1960 through September 1962, you are likely a resident super senior. In fact, there was, located just upstream of the current Highway 78 bridge near the Rockin J. This station logged the flow every day for two years before being abandoned. In Figure 1 below, we plotted the daily flow recorded by this gage with our own monthly flow measurements near the same location just downstream of the bridge. We normalized the two-year time scale to start with October 1 as day #1 to allow overplotting the 1960’s with the 2020’s.
Notice that starting June 1 of both years (day #243 and #608 respectively) our flows measured since 2020 are mostly much lower than those measured by USGS. It’s also relevant to note that our region was in a drought in 1960 and most of 1961, returning to normal and wetter conditions by 1962 (NOAA, 2024). This means that the higher flows of Butcher Creek measured throughout 1960-62 were not predominately caused by wet weather, but by irrigation water carriage and return flows.
Getting into Garth Brooks and Monitoring in the 90’s
If you were sipping on a Crystal Pepsi and listening to Garth Brooks on your pickup radio as you turned up the Butcher Creek road in the 1990’s, you might have spied someone wading the creek taking some kind of measurement. A team of scientists from the SCS (now NRCS), the DHES (now DEQ) and the SCD (same old Stillwater Conservation District), with the help of our local landowners, spent eight years collecting flow and water quality information on Butcher Creek. The goal was to understand the extent and causes of non-point source degradation of Butcher Creek from runoff and irrigation return flows sufficiently to develop on the ground solutions.
We dug out those old files from the depths of the SCD office and extracted 67 flow measurements made from 1991 through 1995, mostly in the growing seasons. We again normalized the time scale to day-numbers, in this case with January 1 as #1. Figure 2 shows the 1990s flow measurements by year between April and October in colored lines. Our SRWQI project made 26 flow measurements between September 2020 and October 2022 which are plotted as individual points (black squares). The 2020 – 2022 flow measurements are mostly on the lower end or less than those made in the 1990s.
Thanks to the thorough science developed in the 1990s studies, we can also compare the suspended sediment load carried by Butcher Creek. The state SCS office at that time (D.Jones, 1993) used 15 paired flow and suspended sediment concentrations collected on Butcher Creek near the mouth to calculate an estimate of the total sediment load for the 1992 April-September period. We duplicated the same procedure using 14 paired flow and suspended sediment values from 2021 and 2022. Figure 3 is a bar chart showing the calculated total sediment loads in tons transported by Butcher Creek for April – September 1992, 2021 and 2022.
The same data allows us to compare the average suspended sediment concentrations and average stream flow rates for Butcher Creek near the mouth in Figure 4. Average sediment concentrations are shown in orange and average stream flow rates in blue for each of the years.
Good scientific assessments often lead us to new questions, and so we can ask why the sediment load of recent years appears to be much less than that documented in the 1990’s studies. Keep in mind that stream flow and sediment transport can vary greatly from year to year, and these data, while reliable, are snapshots in time. Subject to all appropriate limitations, we hypothesize that because recent growing season flow rates of Butcher are significantly less than historical, there is less erosion and sediment transport in the watershed. Lower flow rates, especially lower peak flows, may have allowed for the Butcher Creek channel and banks to better stabilize and revegetate. Some landowners have suggested that farm consolidation and changes in irrigation practices are likely reasons for these observations. We plan to continue our evaluation as more data become available, and we welcome the public’s thoughts and observations.
Stillwater Valley Watershed Council Coordinator, Lindsey Clark, stressed that the data collected by this project is of an educational and non-regulatory nature, intended to provide basic indicators of stream health to inform the residents of the Stillwater Valley and protect all the uses we make of our streams for this generation and those to come.
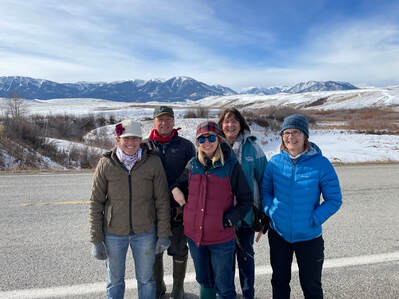 Water monitoring team: Lindsey Clark, Tom Osborne, Cedar Magone, Mary Byron, Karen Marts
STILLWATER RIVER WATER MONITORING PROJECT ONGOING
JULY 8, 2021 - Article courtesy of Brett French, Billings Gazette Outdoor Editor, Published by Billings Gazette
The Stillwater River nourishes residents and visitors, and now that water, essential to so many lives, is being regularly sampled to monitor its health. “It is about raising awareness and making folks in this watershed realize that it will be up to residents to take ownership,” said retired hydrologist and Absarokee resident Tom Osborne. Osborne pitched his services to the SVWC to lead the project, which also includes monitoring two main tributaries to the river, Rosebud and Butcher creeks.
“It fits neatly with their goals,” Osborne said, and “Monitoring ambient water quality is like doing a checkup of yourself,” which after two years of data will provide a baseline. Such programs improve “the local ability to understand where and what activities could help restore or protect water quality in their area,” said Darrin Kron, Water Quality Monitoring and Assessment Section supervisor for the Montana Department of Environmental Quality.
Locally
Osborne’s partners have a deep interest in water. The SVWC was formed in 2010, expanding a weed management organization in the upper watershed valley. Building on the success of that work, the council added water quality, forest health, soil enhancement and education efforts to its agenda.
Lindsey Clark, coordinator of the council, said some landowners were suspicious of Osborne’s intentions at first. “Water can be war,” she explained, especially in years of low flows like this one. Clark is one of the volunteers helping Osborne collect water samples. She has enjoyed seeing the streamflow changes from month to month and learning more about what the sampling will reveal.
Grants
The MT DNRC and DEQ are helping fund the monitoring, providing lab assistants and paying for testing costs, thus far. Those tests can be pricey, running about $9,000 a year for samples taken from nine stations each month. “This initiative really helps many water quality programs in the state do more with the funding we have collectively,” Kron said. The Stillwater water quality program is not unique. Through partial funding from DEQ, eight other groups monitor water quality on streams across the state. On the Stillwater River, Stillwater Mining Co. also conducts monitoring for point source pollution.
Anglers
The Billings Chapter of Trout Unlimited (TU), dubbed the Magic City Fly Fishers, and their state organization, Montana Trout Unlimited, also stepped up to help with funding the program and providing volunteers to help conduct sampling. Lyle Courtnage, president of the Magic City Fly Fishers, has fished the Stillwater for at least 20 years. His group sees the water monitoring project as a way to not only give back to the resource, but also to build relationships with landowners and other river stakeholders. Courtnage said there tends to be a lack of knowledge about trout streams west of the Continental Divide, the monitoring may help fill that void. “As people really understand what’s going on, it will be easier to mobilize support down the road,” Courtnage added. “From a TU perspective, we want people to think about watersheds, and what’s the overall health of a watershed.”
Personal
The water quality monitoring is a way for Osborne to give back to a resource in which he’s long been interested in, invested in and immersed. “For me it’s a legacy thing,” he said. “I’d love to leave the watershed better off.” That’s especially important to Osborne because his grandchildren now recreate on the river, propelling their stand-up paddle boards down the stream.
APRIL 2021 - Watershed “Special Project” Flashback — 1991. George H.W. Bush was president, the Soviet Union began to dissolve, a gallon of gasoline cost $1.14, Down Home by Alabama was the top country song, and the Butcher Creek watershed project kicked off in Stillwater and Carbon Counties. This ambitious watershed assessment and restoration project was led by the SCD when Barbara Berry was the Administrator. At least $412,000 of agency funds came in from the Soil Conservation Service Great Plains program, the State of Montana DNRC, Department of Health and Environmental Sciences, and Montana FWP.
The project focused on Butcher Creek, a tributary of Rosebud Creek that arises at the foot of the Beartooths and discharges to East Rosebud Creek just south of Absarokee. Accounts from the time state that Butcher Creek has substantial sediment load that impacts the cold-water fisheries of Butcher Creek, the Rosebud and Stillwater River. The project included water quality monitoring and landowner-identified streambank and riparian restoration projects.
The natural flow of Butcher Creek has been altered since 1894 by the transfer of water for irrigation from East Rosebud Creek. The increase of flow in a channel mostly formed in soft erodible soils has led to chronic streambank erosion. Management of irrigation water and return flows are a challenge on the relatively steep slopes of the basin.
The Butcher Creek project ran for at least eight years, resulting in erosion control projects like willow planting, off-stream livestock watering and irrigation water controls. An extensive set of water quality data were collected that attempted to see whether the restoration projects led to measurable reductions in sediment and nutrients in the basin. A large file drawer of information on this project was recently “found” and is being evaluated to re-learn the lessons contained on the many typewriter-written pages. It is pretty clear that the project was an example of positive watershed cooperation among the many landowners, scientists and citizens involved.
Flash forward to 2020 when SVWC’s watershed monitoring and GIS project kicks off. Last fall, the SVWC formally released its latest project aimed at continuing a watershed assessment project, monitoring the health of streams and developing geographic information system (GIS) mapping capability in the watershed. An impressive array of partners have come together for this project including the Stillwater Conservation District (SCD), Natural Resource Conservation Service (NRCS) Columbus office, FWP, the U-cross Foundation-Yale School of the Environment, Trout Unlimited and Tom Osborne, a local retired hydrologist. The project is called the Stillwater-Rosebud Water Quality Initiative (SRWQI).
The SRWQI involves monitoring basic water quality parameters at sites in the Stillwater-Rosebud drainages roughly monthly over a two-year period beginning October 1, 2020. Other than at certain facilities like Sibanye Stillwater Mine and community wastewater plants, there has not been routine water quality monitoring in the watershed since the United States Geological Service dropped their monitoring program eight years ago. “Our streams are such a valuable asset to our lives we can’t afford to neglect their health either”, said to Tom Osborne who has volunteered to take the lead on this project with support from the SVWC board and local volunteers.
The companion GIS effort involves mapping key natural resource features in the watershed from the large bank of data sources available from state, federal and local agencies. The SVWC has at its disposal a graduate research assistant located at Yale University who, working remotely under local supervision, will pull various data layers together into a system usable by the SVWC and other local entities.
The project’s moving parts came together this past summer after the SVWC was approached by Tom Osborne of Absarokee, who volunteered to help lead the work on the ground. Tom is a retired professional hydrologist who has worked on water resource projects around Montana for the past 45 years. The project is looking for local students and adults interested in getting involved.